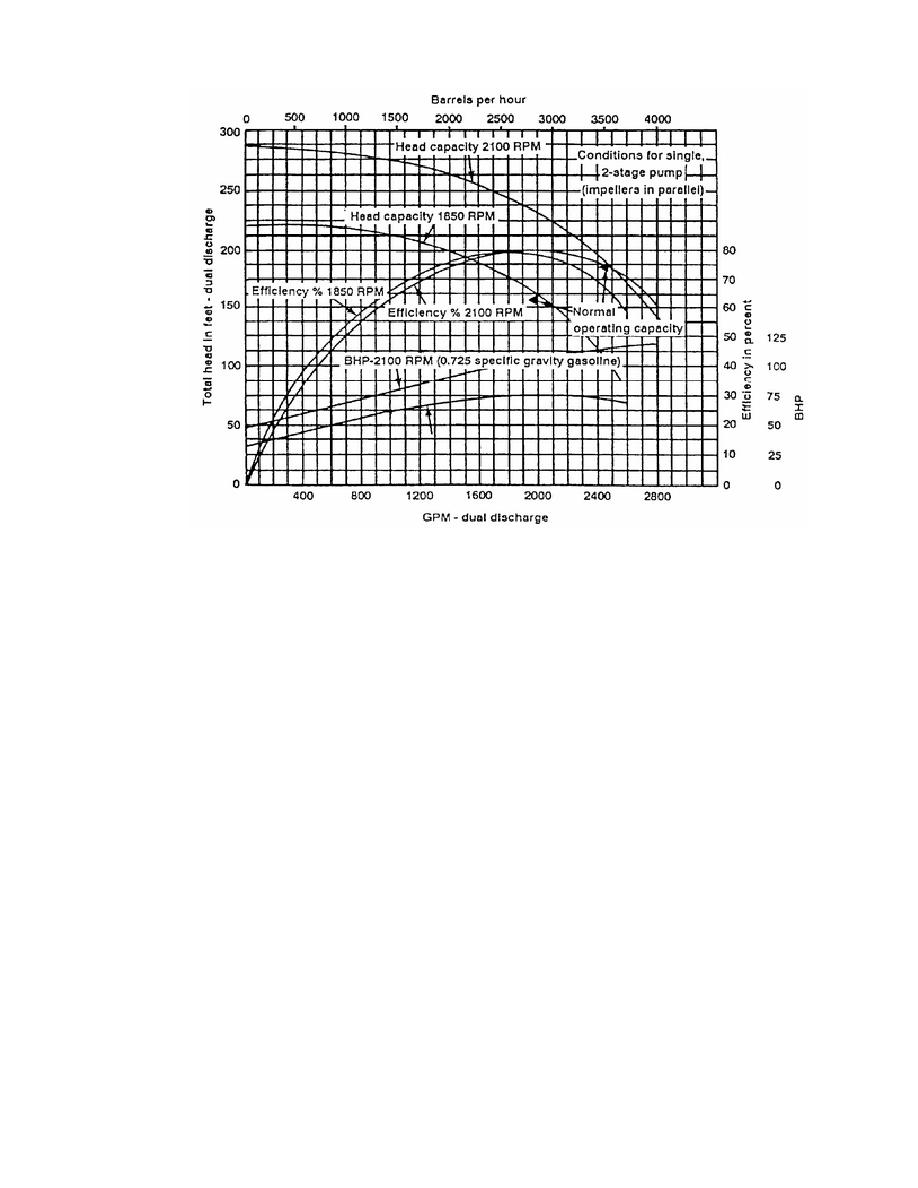
Figure 11-1. Pump graph.
Pump graph application.
A common application of a pump graph (Figure
11-1) is its use in determining the rate of flow, efficiency, and BHP,
given the total dynamic head in feet and operating speed of the engine in
RPM. Recall the definition of dynamic head--the height to which a pump
can push a column of liquid. Rate of flow is the most commonly desired
variable on the graph, and can be expressed in either GPM or barrels per
hour. At an engine speed of 1,800 RPM and total dynamic head of 160
feet, determine the following:
Rate of flow (GPM).
Efficiency (percent).
Brake horsepower (BHP).
To solve this problem, enter the graph on the Y axis at 160 feet of head.
Follow this line to the right until it intersects the head capacity curve
for 1,800 GPM. At this point, all answers are determined vertically up
and down.
To read rate of flow in GPM, drop down to the X axis and read the
answer 850 GPM.
To determine the efficiency, drop down to the efficiency curve
and read the percent efficiency in the right-hand margin (70 percent).
The BHP is similarly read. Drop down to the BHP curve for gasoline
and read the answer (35 BHP).
NOTE: BHP is expressed with a given specific gravity fuel. For design
purposes, we use 0.8524 specific gravity diesel fuel.
PART E - DETERMINATION OF PUMP SPEED
12-100
QM 5099


 Previous Page
