4.
Characteristics of Pump Graphs:
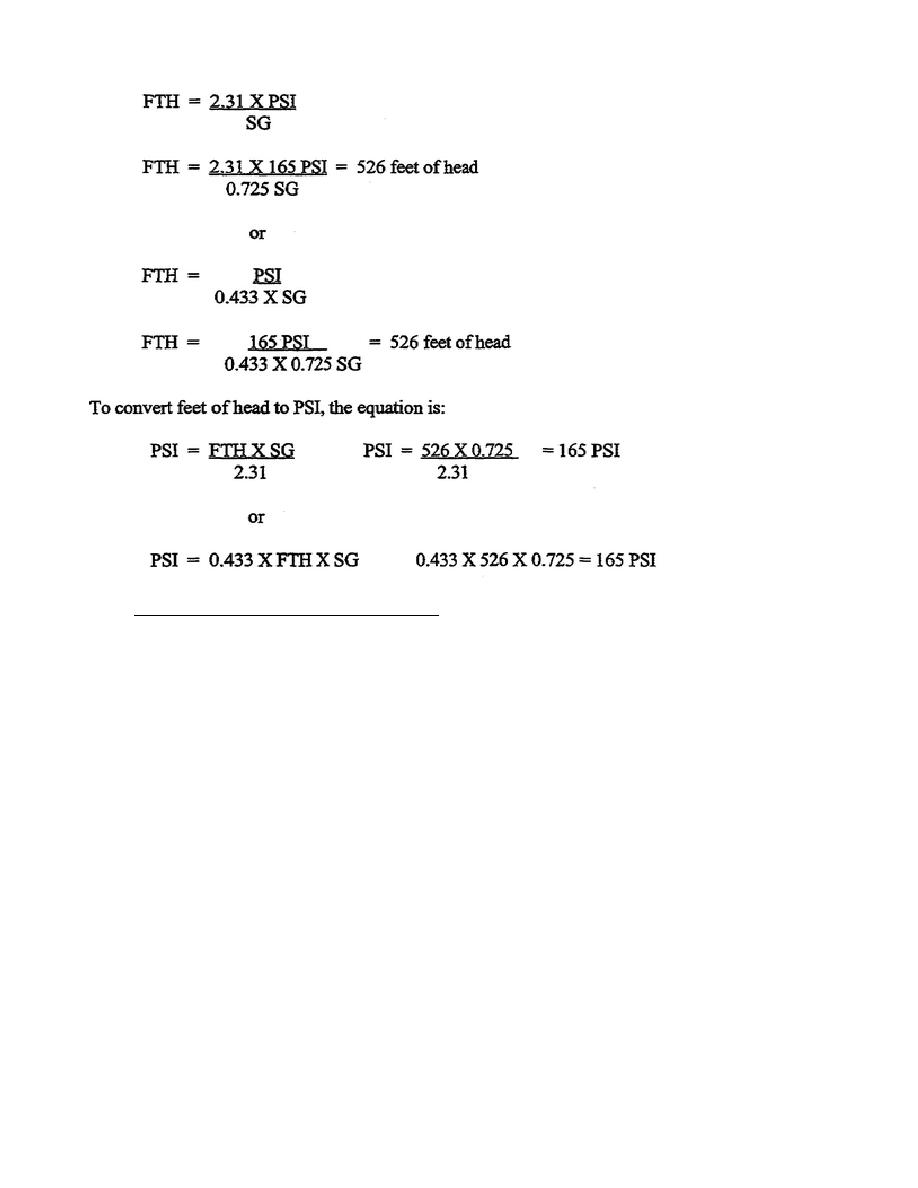
A pump graph is constructed to show
feet of head.
It also shows the flow rate in gallons per minute, and
barrels per hour. Pumps are equipped with gauges that register the suction
and discharge pressure in PSI.
Therefore, the operator must be able to
convert PSI to feet of head to determine the flow rate and efficiency of the
pump.
a. Data on pumping capacity, operating characteristics, operation, and
maintenance procedures are in the manufacturer's manual which is packaged
with each pump.
Presently petroleum pipeline operations consist of the
IPDS. In this system, there are three different sizes of pumps, the 6-inch
single-stage, 600-GPM self-priming pump; the 6-inch, single-stage, 1,250-GPM
self-priming pump; and the 6-inch, three-stage, 800-GPM mainline pump
(IPDS).
b. See Figure 1.
It is a uniform scale; that is, there is an equal
space between all units on the graph in both directions. Rate of flow is
plotted along the horizontal axis, increasing from left to right in GPM
(cubic meters per hour) on the bottom. The remaining variables are plotted
along vertical axis, increasing from bottom to top. Each of the RPM curves
represents the other variables at a specific engine operating speed. Engine
speed is shown in 100 RPM increments from 2,000 RPM to 2,400 RPM (maximum
governed speed). Along the left side of the scale, discharge pressures are
shown in PSI and FTH for 1.00, 6.72, and 0.85 specific gravity liquids.
5
QM5201


 Previous Page
