INTRODUCTION
As a Petroleum Laboratory NCO, you must be prepared to make recommendations on the proper disposition
of deteriorated petroleum products. Remember, the sending unit relies on your good judgment.
PART A - BLENDING RATIO
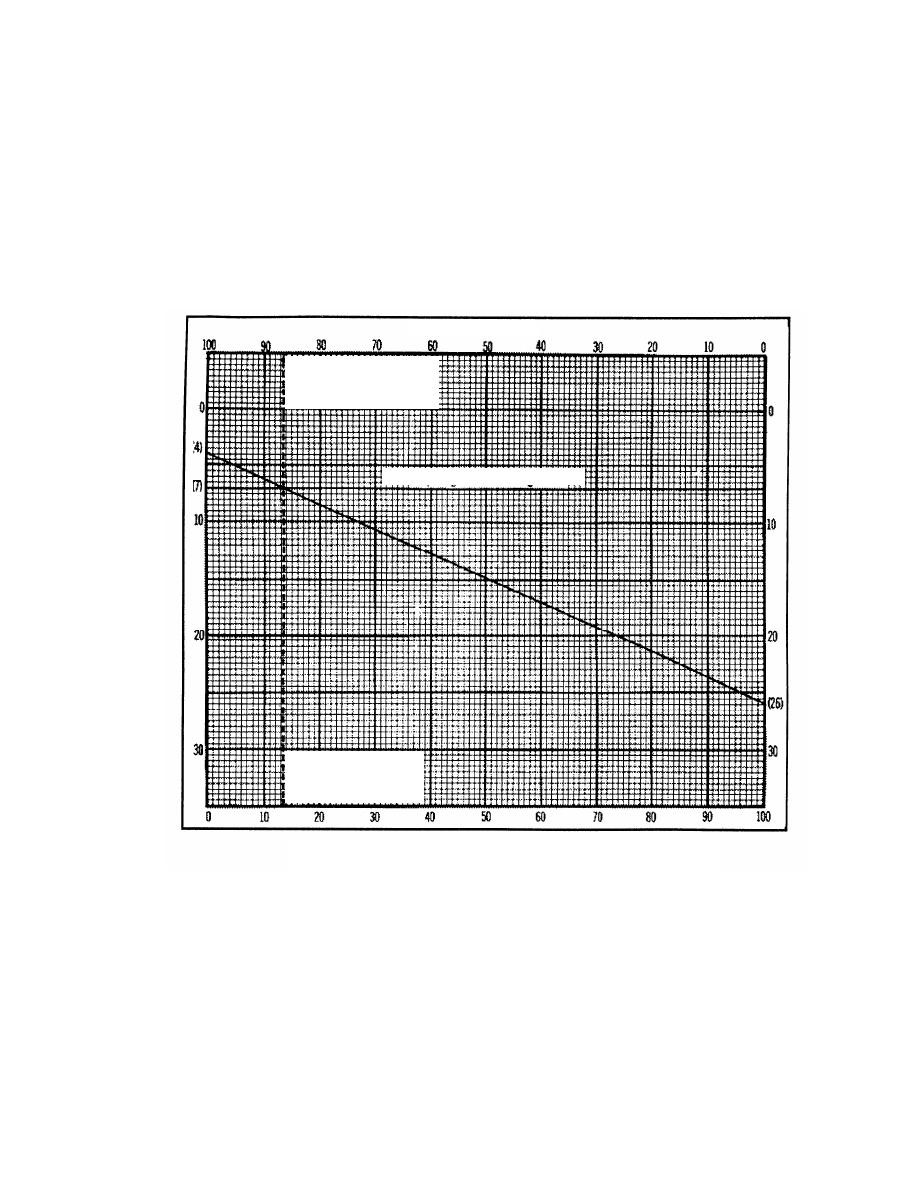
A specimen graph (Figure 4-1) can be used instead of a formula to approximate a blending ratio. Other
properties with appropriate scales can be substituted. The results provide only pilot blends, and each pilot
blend must be tested and adjusted as needed. It is a good practice to allow a safety factor in any
reclamation blending.
Percent of Fresh Stock
Approximate percent
containing 4mg gum/100ml
Required gum content of 7mg/100ml
Approximate percent of
product containing
26mg/100ml
Fig. 4-1. Specimen Graph To Approximate A Blending Ratio.
Problem. Prepare a pilot blend of fresh, on-specification MOGAS containing 4 mg gum/100 ml and off-
specification MOGAS containing 26 mg gum/100 ml to produce a mixture containing 7 mg gum/100 ml.
Solution. Prepare a graph showing percentage of on-specification stock across the top from 100 to 0 and
percentage of off-specification stock across the bottom from 0 to 100. Show gum content (or other property
on a suitable scale) at both sides of the graph from 30 to 0.
Draw a line across the graph at the point that represents required gum content 7 mg/100 ml.
Draw a line from the point that represents gum content of 4 mg/100 ml on the left-hand scale to the point
that represents gum content of 26 mg/100 ml on the right-hand scale.
Project the point of intersection between the sloping line and the 7 mg/100 ml line to the top and bottom
scales, and read approximate percentage of fresh and old stocks for the pilot blend.
4-2
QM 5182


 Previous Page
