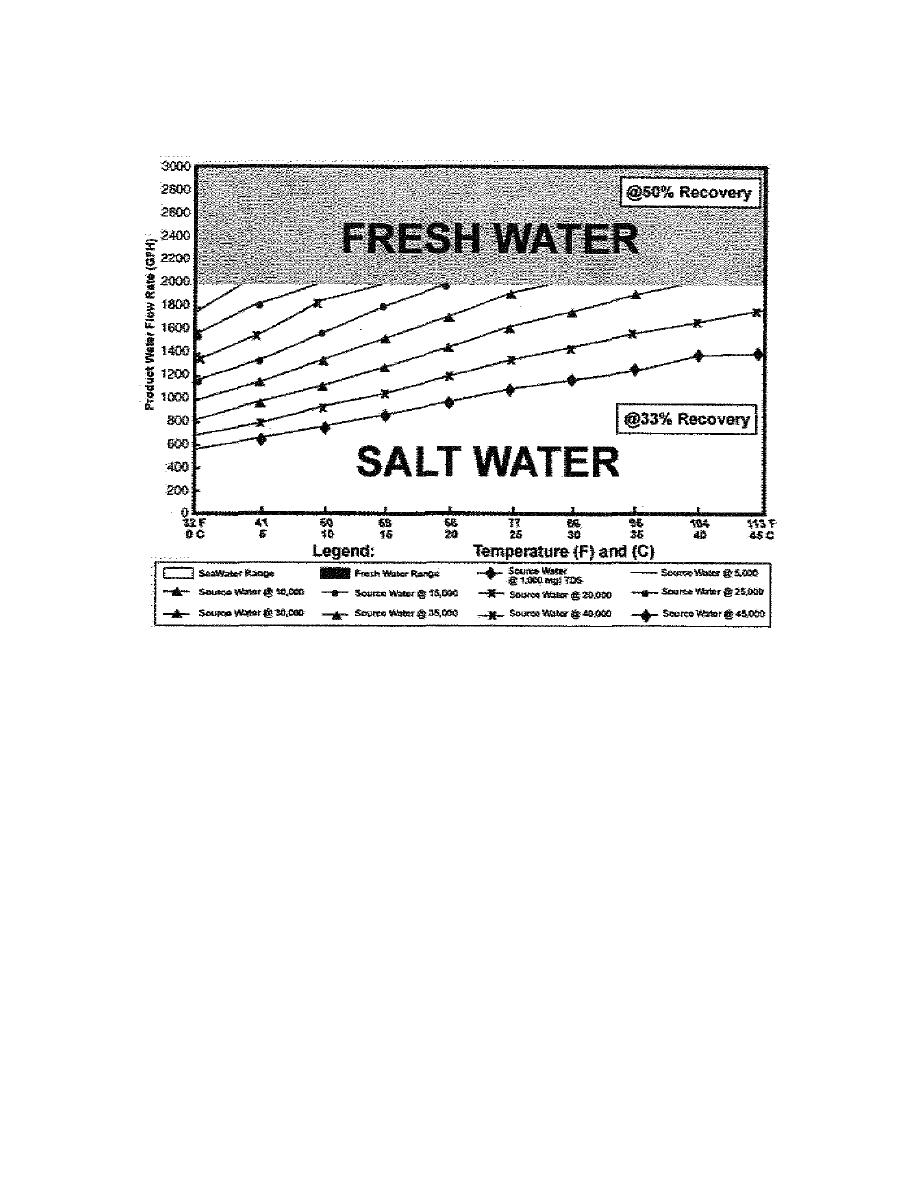
have to calculate the flow of one ROWPU. To do this, use the Water Production Graph (Fig. 1-1) to determine the production
flow of one ROWPU.
Fig. 1-1. Water production for the 3,000-GPH ROWPU operating @ 900 PSI
Before using the Water Production Flow Graph (Fig. 1-1), you need to have information on the water quality, TDS, and
water temperature. From the scenario, you are given that the water quality is saline, the TDS is at 35,000 milligrams per liter,
and the water temperature is 30C. By applying this scenario information to the Water Production Flow Graph (Fig. 1-1), you
can determine the production flow of one ROWPU.
The procedure to follow involves three steps. First, locate the legend box at the bottom of the graph. Find the line for
TDS of 35,000 milligrams per liter. (It will have a triangle on the line.) Locate that line in the saltwater part of the graph.
Next, you need to locate the temperature of 30C on the horizontal line (or y-axis) of the graph. From that point, you need to
cross match it to the line indicating 35,000 TDS (that is the third line up from the y-axis above the 30€C). Finally, from the
intersection of that point, draw a line across to the vertical line to the left (or x-axis) labeled Product Water Flow Rate in
gallons per hour (GPH). You will cross that line (x-axis) about midway between 1600 and 1800 GPH. This point is
approximately 1700 GPH.
1-5


 Previous Page
